Import Dynamics
Which countries lead avocado imports in Europe?
The Netherlands leads European reception, the United Kingdom and Germany boost demand, and Peru accounts for 91% of the volume.
The European Hass avocado market closed the first half of the year with a clear upward trend. Behind this growth are markets that continue to expand their consumption capacity and solidify the avocado as a staple in European cuisine. The increase in imports during the first half of 2026 was not only due to the large volume shipped from Peru , but also to a constantly expanding regional demand.
The Netherlands: the hub of European distribution
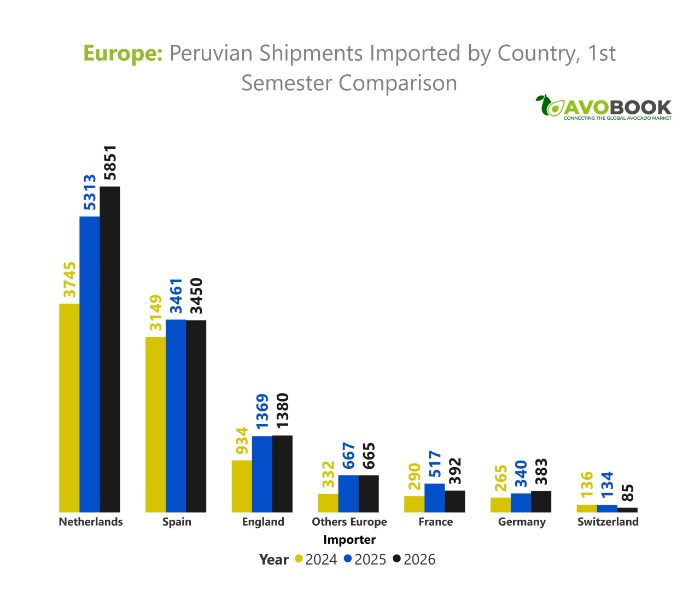
The first half of the year reaffirmed the Netherlands' strategic role as the main entry point for avocados into Europe. The figures show that between January and June, the Netherlands received 5,851 containers, compared to 5,313 in 2015 and well above the 3,745 recorded in 2024. This growth confirms its logistical importance as a distribution platform for much of the continent.
Stability in Spain and expansion in the United Kingdom and Germany
Spain ranked second among destinations for Peruvian avocados in the Americas. In the first half of the year, it received 3,450 containers, a volume virtually identical to the previous year's (3,461), reflecting the maturity of a market with high and consistent demand.
For its part, the United Kingdom shows very consistent progress. Shipments grew from 934 containers in 2024 to 1,369 in 2025 and 1,380 in 2026, confirming a sustained expansion trend. Germany is also strengthening its share: arrivals gradually increased from 265 to 340 and reached 383 containers this year, consolidating its position as one of the fastest-growing markets.
In contrast, not all markets evolved in the same way. France registered uneven performance, falling to 392 containers (after reaching 517 in 2025), while Switzerland showed the most significant decline, dropping from 134 to 85 containers due to internal trade dynamics.
Peru's dominance and pressure on prices
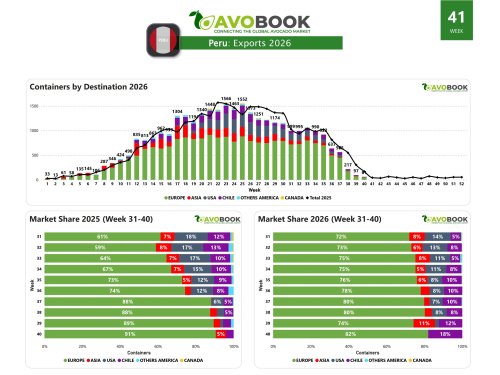
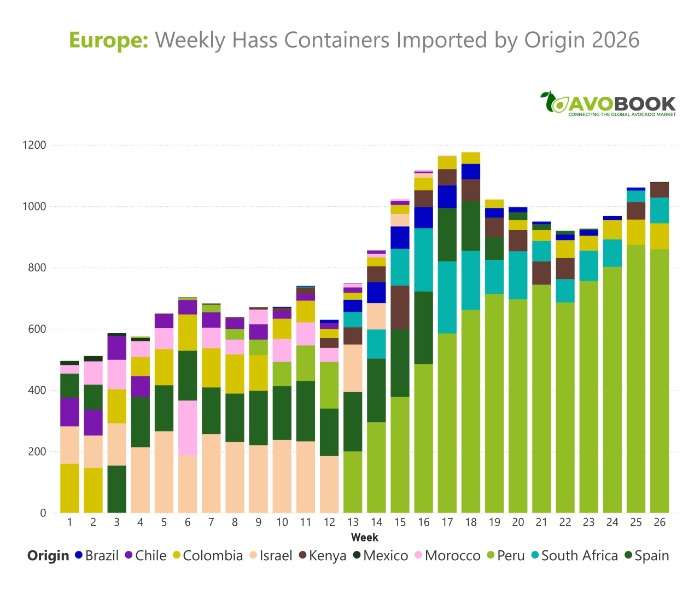
The total volume shipped to Europe grew steadily, starting at 496 containers in week 1 and reaching a maximum of 1,178 containers in week 18, before stabilizing in a high range of between 920 and 1,080 loads towards the end of the semester.
Peru was the driving force behind this increase. After a modest start, the turning point came between weeks 13 and 15, when shipments jumped from 200 to 485 containers per week, displacing suppliers such as Israel, Morocco , Chile , and Spain. By week 26, Peru was leading the supply with 860 of the 947 containers received, representing 91% of the total volume.
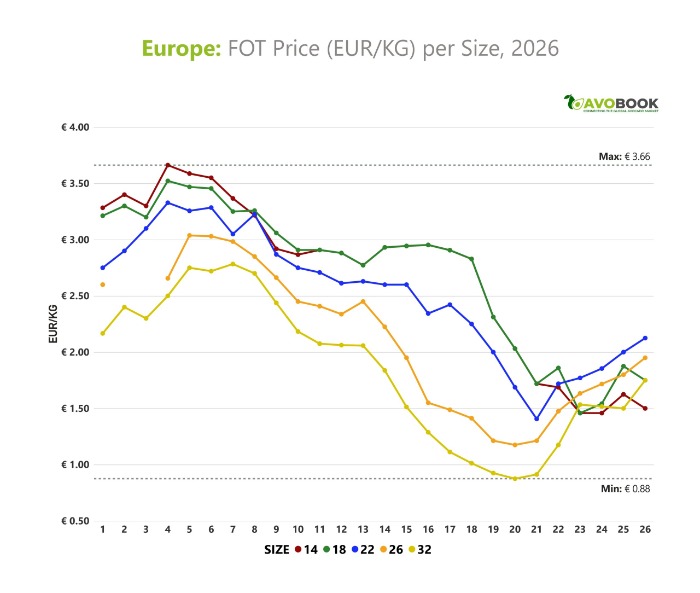
This high availability put downward pressure on FOT prices throughout the first half of the year, with an overall average of €2.38/kg. Size 14 saw an initial peak of €3.66/kg (week 4) before falling to €1.50/kg by week 26. Meanwhile, size 32 reached a low of €0.88/kg in week 20. Despite the overall adjustment, the larger sizes (14 and 18) consistently remained at the higher end of the price curve.
A market in full development
The first half of the year confirms that Europe continues to increase its absorption capacity. With the Netherlands leading the way in logistics, the UK and Germany driving consumption, Spain providing stability, and specific adjustments in France and Switzerland, the sector's future will depend on the balance between this expanding demand and a coordinated global supply.