Frozen avocado industry
Frozen avocado: its weight in Peru's exports
Peru will export 23,600 tons of frozen avocados in 2026, with a peak between June and August, and Belgium leading as a destination.

Frozen avocados represent a smaller share of the Peruvian export market compared to fresh avocados . According to Avobook's data team, shipments reached approximately 23,600 tons during the analyzed period in 2016, a volume equivalent to about 3.5% of the total Hass avocados exported up to week 36.
This comparison allows us to understand the current weight of the processed product. Added to this scale is a defined commercial structure. The largest shipments are concentrated between June and August, Belgium is the top destination for the product, and five exporting companies account for approximately two-thirds of the volume.
Seasonality: the peak export window for frozen avocados
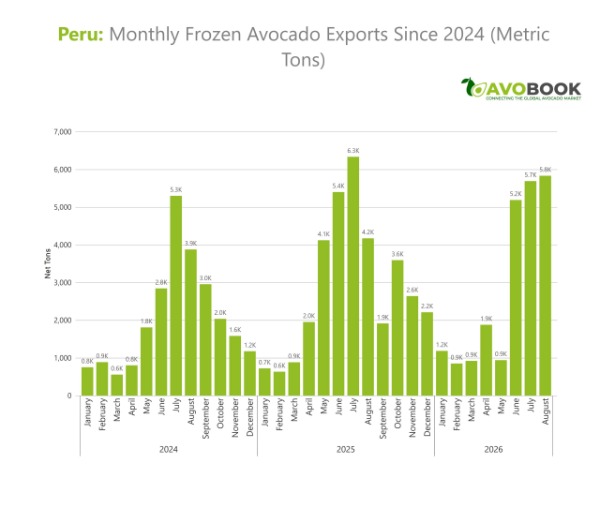
The monthly series shows a marked seasonality in frozen avocado exports from Peru. The highest volumes are recorded between June and August, while the first quarter shows the lowest levels of activity.
In 2024, the monthly peak was reached in July, with approximately 5,300 tons. In 2025, the same month saw shipments reach approximately 6,300 tons, in a season that showed higher volumes than the previous one.
For 2026, data available up to August shows approximately 5,200 tons in June, 5,700 in July, and 5,800 in August. August was the month with the highest volume of the year up to that point and surpassed the August figures for the two previous seasons.
Monthly data shows intense activity during that part of the year. However, the peak recorded in 2026 through August is still below the 6,300 tons observed in July 2025.
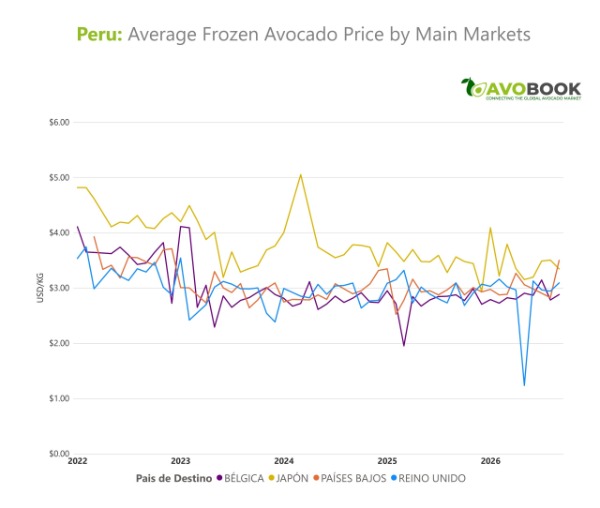
Evolution of destinations: Belgium consolidates its position as the leading market
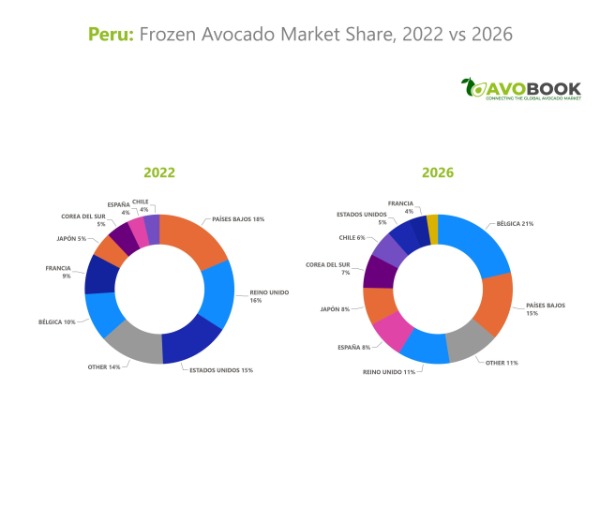
In addition to its volume, this category shows changes in the distribution of its markets. Between 2022 and the available data for 2026, Belgium increased its share from 10% to 21%, becoming the main destination for Peruvian frozen avocados.
The Netherlands remains in second place, although its share fell from 18% to 15%. The United Kingdom dropped from 16% to 11%, while the United States saw a reduction from 15% to 5% and France from 9% to 4%.
Other destinations gained importance in exports. Spain went from 4% to 8%; Japan, from 5% to 8%; South Korea, from 5% to 7%; and Chile , from 4% to 6%. China and Canada appear in the 2026 distribution with 3% and 1%, respectively.
These variations reflect relative market shares. A lower share does not necessarily imply a decrease in the absolute volume shipped to each market. It should also be noted that the 2026 data represents a year that may still show changes in the analysis.
Market concentration: The main exporting companies in Peru
The exporter structure shows a high degree of concentration. Sunshine Export leads the 2026 ranking with 4,358 tons and an 18.5% market share, followed by Agroindustrias AIB, with 3,925 tons and 16.6%. Together, they account for approximately 35% of the volume.
Next are Agrícola y Ganadera Chavín de Huantar, with 2,739 tons and 11.6%; Virú, with 2,510 tons and 10.6%; and Agroempaques, with 2,170 tons and 9.2%.
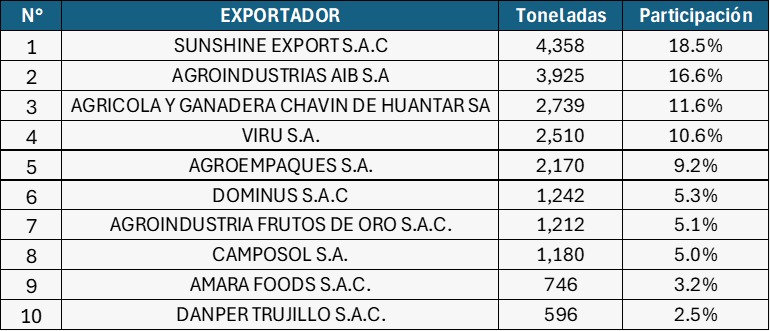
Collectively, the top five companies account for approximately 67% of frozen food exports. Expanding the ranking to the top ten exporters, this share reaches roughly 88%.
The report places frozen fruit as a relatively small category compared to fresh fruit, but with an export volume of 23,600 tons and a clearly identifiable commercial distribution network. The 3.5% comparison allows us to establish its current size; determining whether it is gaining market share against fresh fruit will require observing the evolution of both products over equivalent periods.