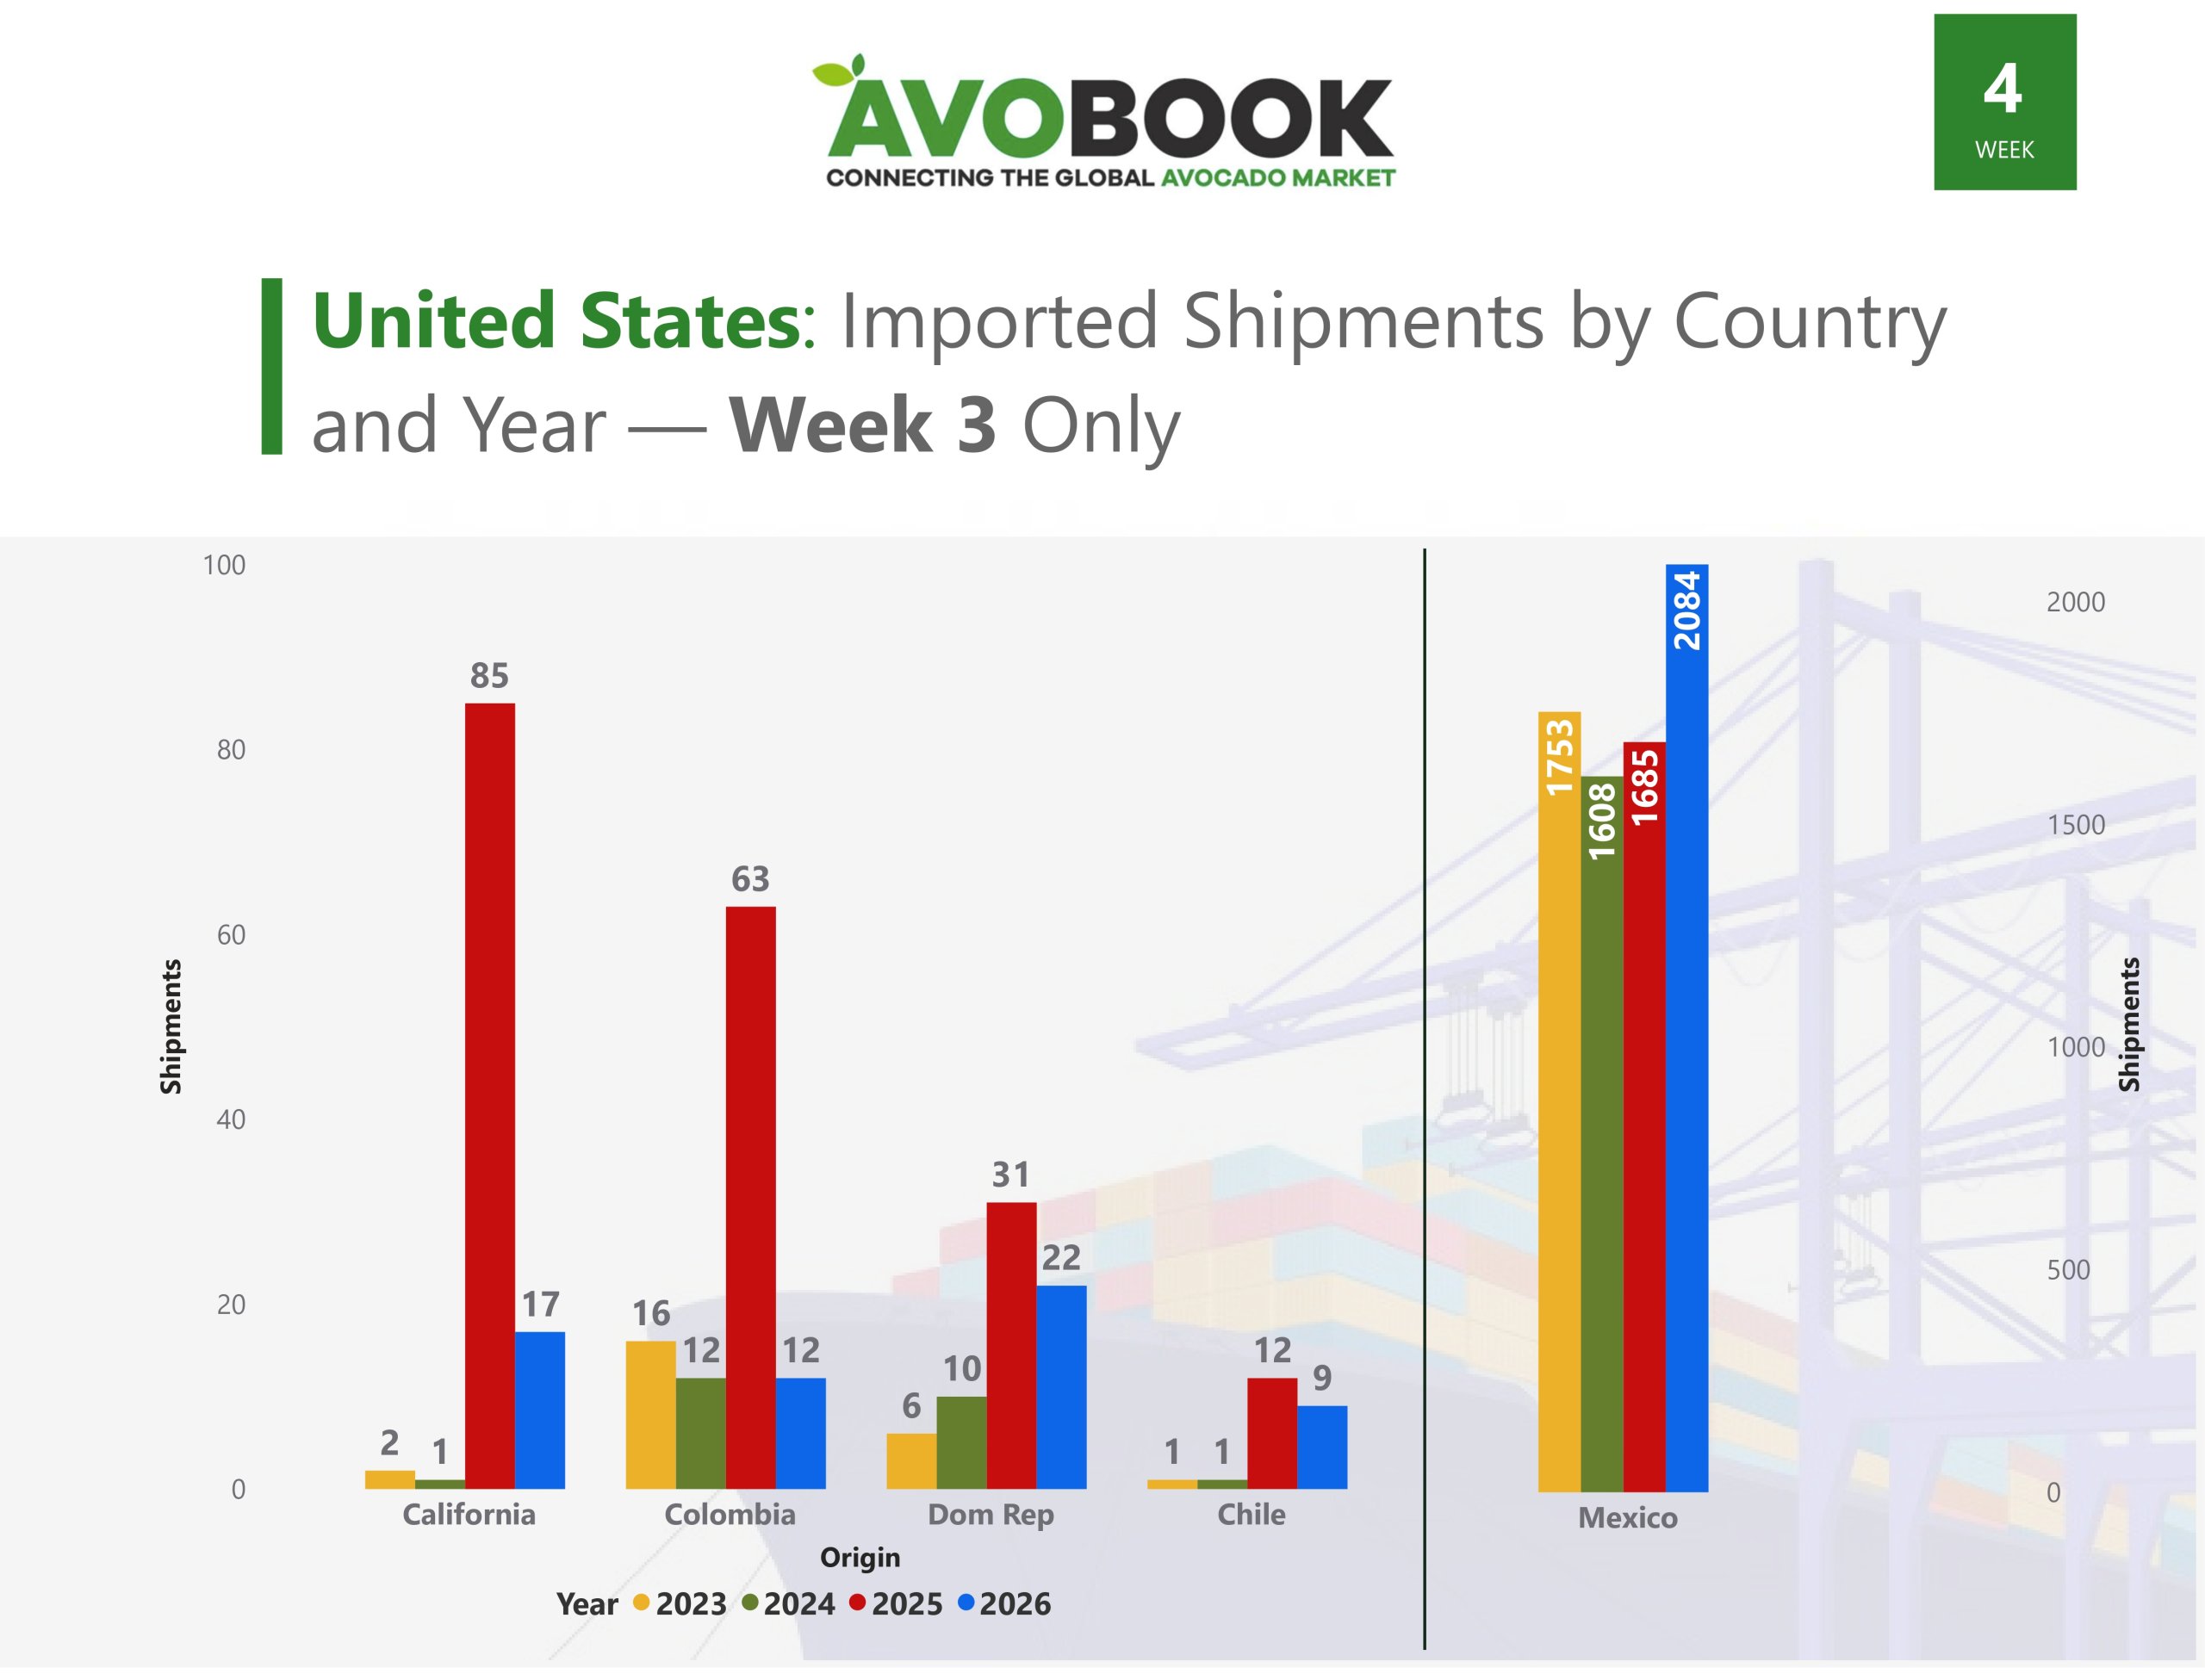
Week 3 confirms a strong rebound in the volume imported to the US.
The US is increasing imports, and Mexico accounts for 97% of the volume.
Week 3 of 2026 shows a year-on-year increase of 16% in imports to the US, with Mexico reinforcing its dominance and other origins losing share.
During week 3 of 2026, the U.S. avocado market saw a significant increase in imports, solidifying a high-volume trend for the start of the year. According to analysis by the Avobook data team , estimated arrivals reached 2,144, representing a 16% increase compared to the same week in 2025, when 1,875 shipments were recorded.
The year-over-year increase is mainly due to Mexico's performance, which continues to be, by a wide margin, the leading supplier to the US market. In the week analyzed, Mexican products accounted for 97% of total imports and increased their shipments by 24% compared to week 3 of last year, reinforcing their dominant position during a key supply period.
In contrast, the other origins showed a significant year-over-year loss of market share. Colombia registered an 81% decrease in its arrivals compared to the same week in 2025, while California reduced its shipments by 80%. The Dominican Republic saw a 30% drop and Chile declined by 24%, reflecting a scenario of greater dependence on Mexican supply in the US market.
However, the weekly analysis provides a somewhat more balanced signal in the short term. When comparing the data with week 2 of 2026, most origins—with the exception of Chile—showed an increase in arrivals, suggesting a logistical and commercial adjustment after a slower start to the year for some secondary suppliers.
Thus, week 3 reveals a US market with greater available volume, strongly supported by Mexico, while other origins face the challenge of regaining market share in a context of high concentration and increasing competition.