US: How oversupply led to the lowest price
Record volumes in 2025 broke the historical price pattern. Mexico, Peru, and Colombia pushed the market down to its lowest level in seven years.
During 2025, the US avocado market faced an unusual combination of factors that ultimately drove prices to levels not seen since 2018–2019. The convergence of exceptionally high volumes and a reshuffling of major supplying origins altered the usual market dynamics and marked a turning point in price formation.
Far from being a response to a one-off adjustment or an isolated situation, the decline was the result of an accumulation of structural factors that ultimately put sustained pressure on the market. Analysis of prices and volumes confirms that the main trigger was a significant increase in available supply, accompanied by a change in the composition of the origins supplying the United States.
According to Avobook's Data team, the 2025 season was marked by a significantly larger Mexican harvest. While the total additional volume is not yet precisely defined, estimates place the increase between 10% and 20% compared to previous seasons. This increase alone already implied significant pressure on prices, considering that Mexico continues to be the dominant player in the US market.
However, the differentiating factor this season was the convergence of this larger Mexican volume with a historically high Peruvian campaign. Peru shipped a higher volume to the United States than in previous years, the highest recorded to date, increasing direct competition in a market that was already showing signs of saturation. Added to this was the presence of Colombia, which went from being an occasional supplier to a consolidated one, especially during its mid-year flowering period, with a clear logistical advantage on the East Coast.
The result of this combination was a record-breaking second half of the year in terms of volume. Statistics show that fruit deliveries during the second half of the year were significantly higher than in the second halves of previous seasons, creating a scenario of sustained oversupply that ultimately translated directly into higher prices.
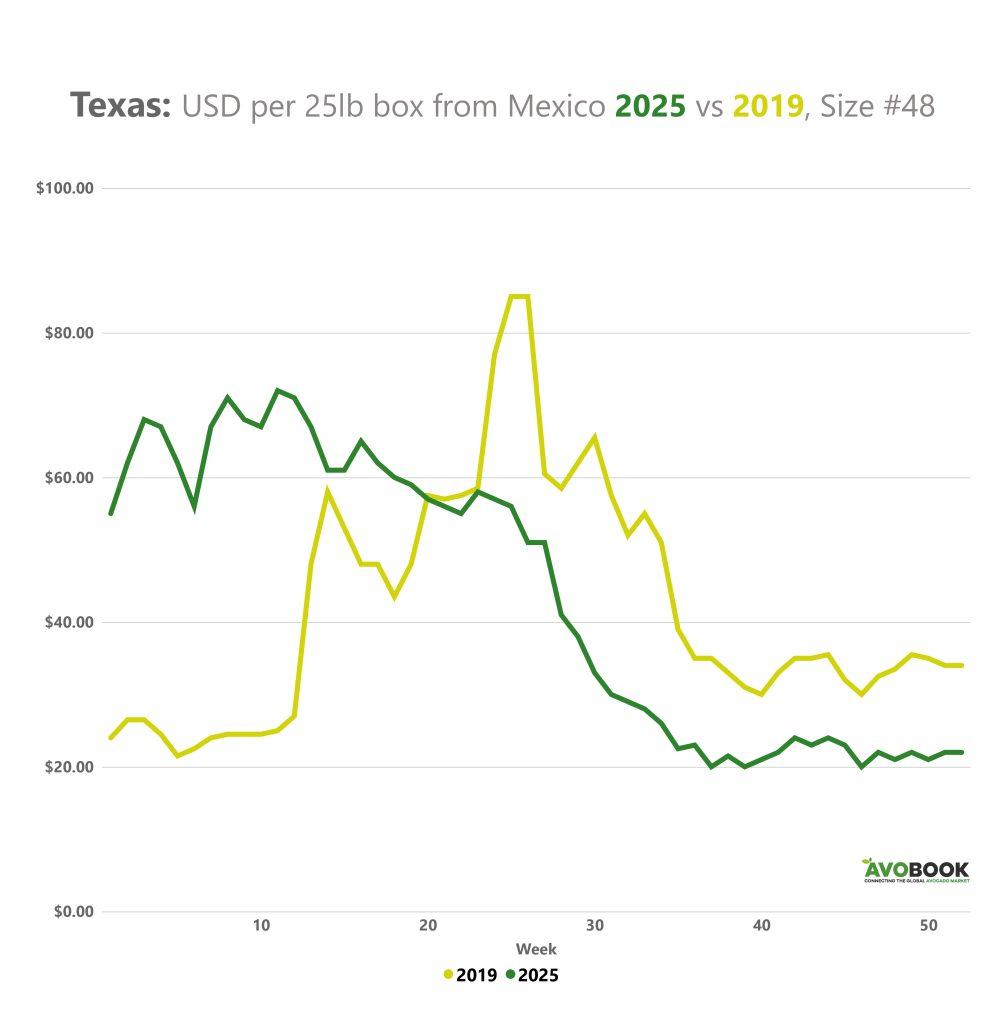 Comparing 2025 and 2019 prices for size 48 Texas coffee reveals a profound shift in market dynamics. In previous seasons, such as 2019, the behavior was relatively predictable: prices peaked around mid-year, coinciding with the transition between seasons, and then gradually adjusted.
In 2025, that pattern did not repeat itself. The season began with exceptionally high prices, even nearly tripling the levels seen in 2019 during the first few weeks. However, after the main season ended, the market entered a phase of gradual correction. From mid-year onward, prices began to decline sharply, reaching historically low levels and closing the year with a curve similar in shape to that of 2019, but based on a significantly lower base.
This behavior confirms that the market did not face a simple seasonal adjustment, but rather a structural pressure stemming from the excess supply accumulated during the year.
High highs, ever-deepening lows
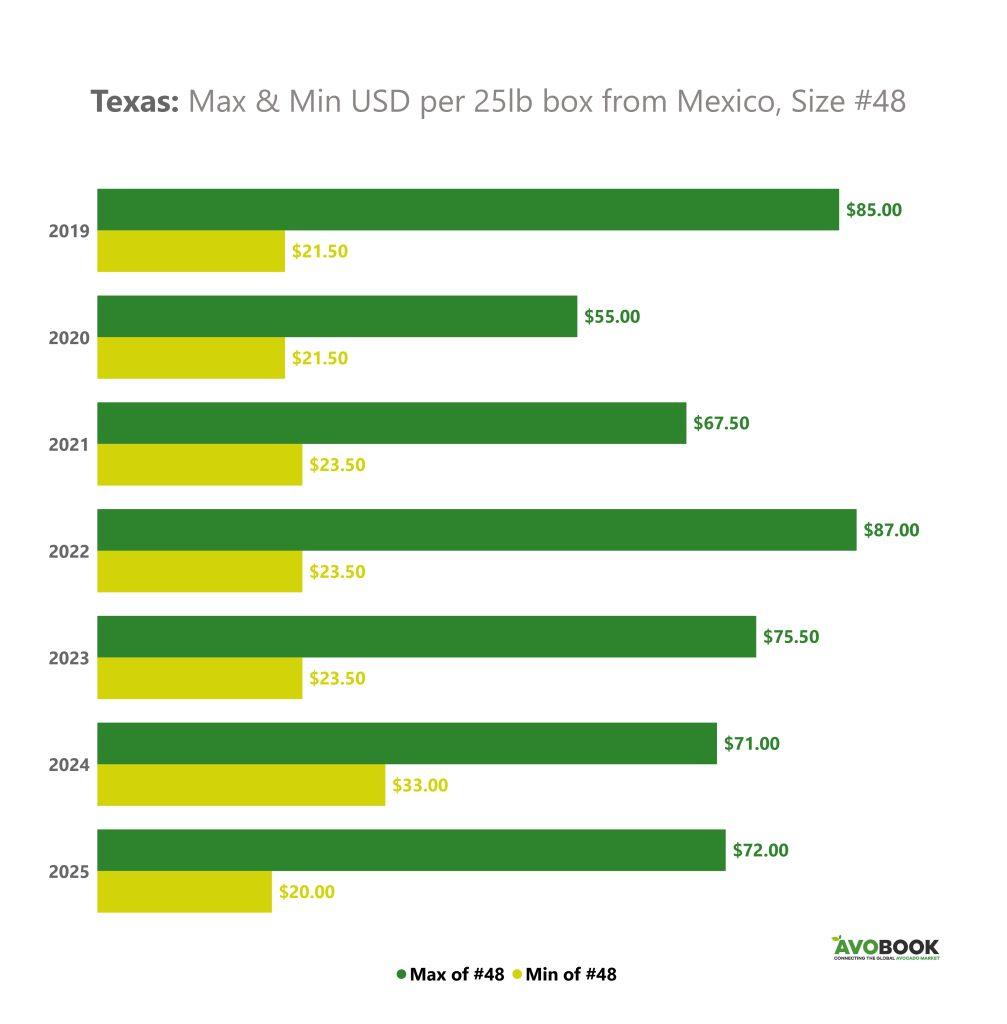
Analysis of the highest and lowest prices per year reinforces this interpretation. The 48-gauge reached its peak in 2022, when prices hit USD 87 per 25-pound box, reflecting a context of lower availability and tighter demand. In contrast, the lowest prices have shown a downward trend in recent years.
While low levels had already been recorded in previous seasons, the low reached in 2025—USD 20 per 25-pound box—stands as the lowest of the analyzed period. This data is key to understanding the magnitude of the adjustment: the market not only corrected from high highs, but also deepened the decline to a new all-time low.
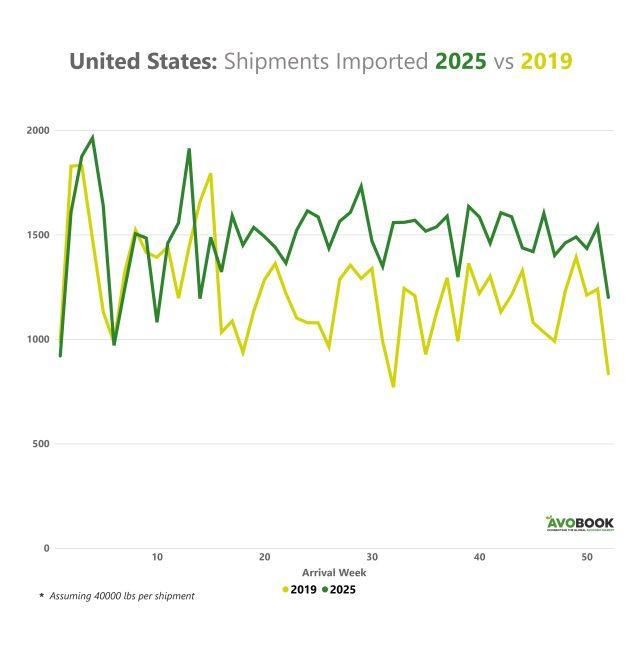
Analyzing imported shipments helps explain why the market failed to recover prices. During the first 10 to 15 weeks of the year, the volumes for 2025 and 2019 showed relatively similar trends. From that point onward, the difference becomes evident: week after week, the volume imported in 2025 was considerably higher than that of 2019.
Furthermore, the fruit flow in 2025 shows less abrupt fluctuation from week to week, indicating a more consistent and sustained supply. This continuity limited any natural market adjustments, keeping prices under pressure for much of the year.
The comparison between 2018–2019 and 2025 also reflects a shift in the players supplying the United States. Mexico continues to lead, but its market share has been declining slightly due to Peru's sustained growth and Colombia's consolidation. Meanwhile, Chile has reduced its presence to marginal levels, limiting itself to specific supermarket programs and refocusing its strategy on Europe and Latin America, where it faces different competition.
Taken together, these factors explain why the US market reached its lowest price in the last seven years in 2025. Rather than an anomaly, the current scenario appears to be the logical consequence of a market with greater volume, more origins, and a supply that, at least in the short term, grew faster than the capacity for consumption to absorb it.